- Tornillo Independent School District
- Financial Transparency
Financial Transparency
-

The purpose of this page is to publish financial data that informs and provides accountability to our taxpayers. The information contained within this page provides a snapshot of the most important pieces of information in a readily accessible format and serves as an opportunity for the TISD to highlight key data in our annual financial report and direct the public to other details contained within it.
For more information on the transparency of local government, including local debt, please visit TexasTransparency.org
-
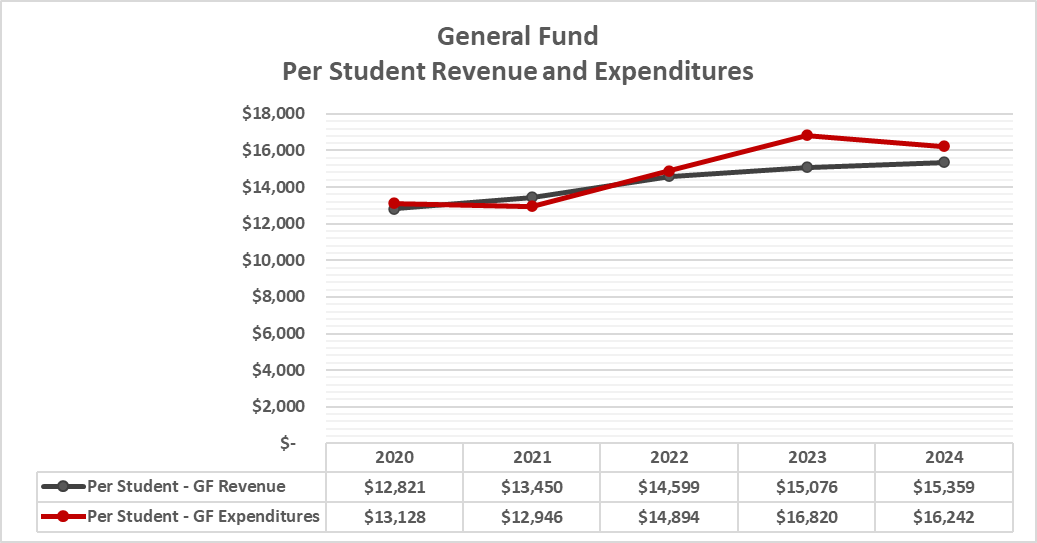
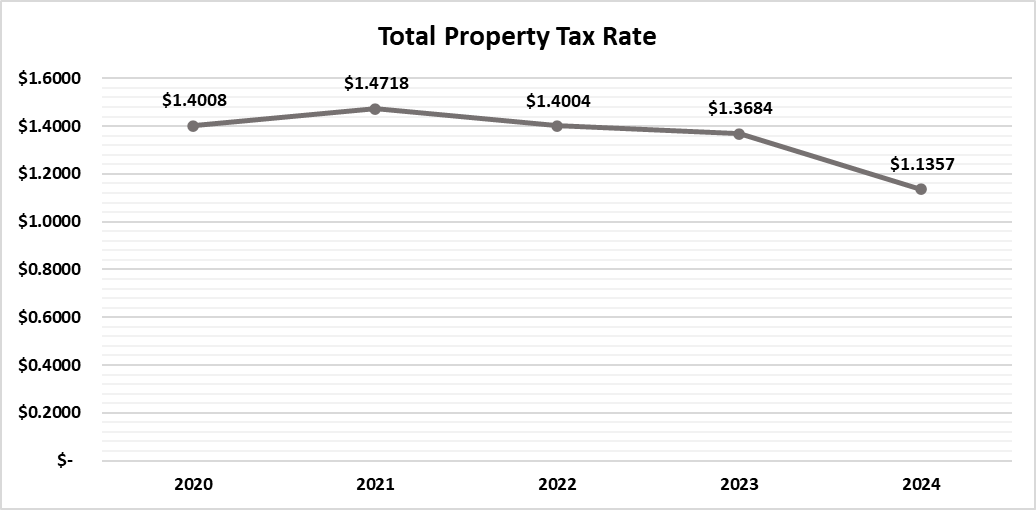
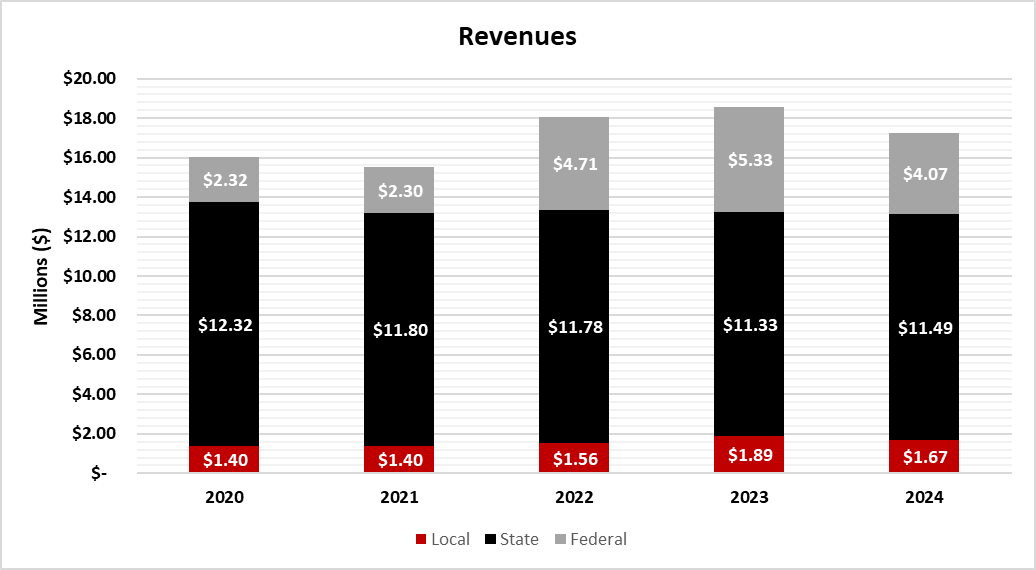
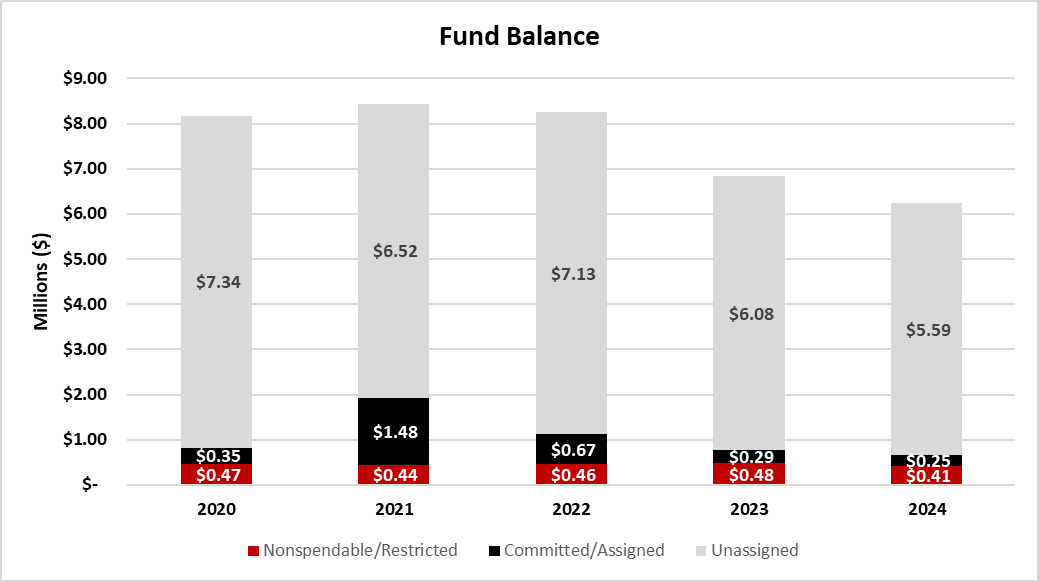
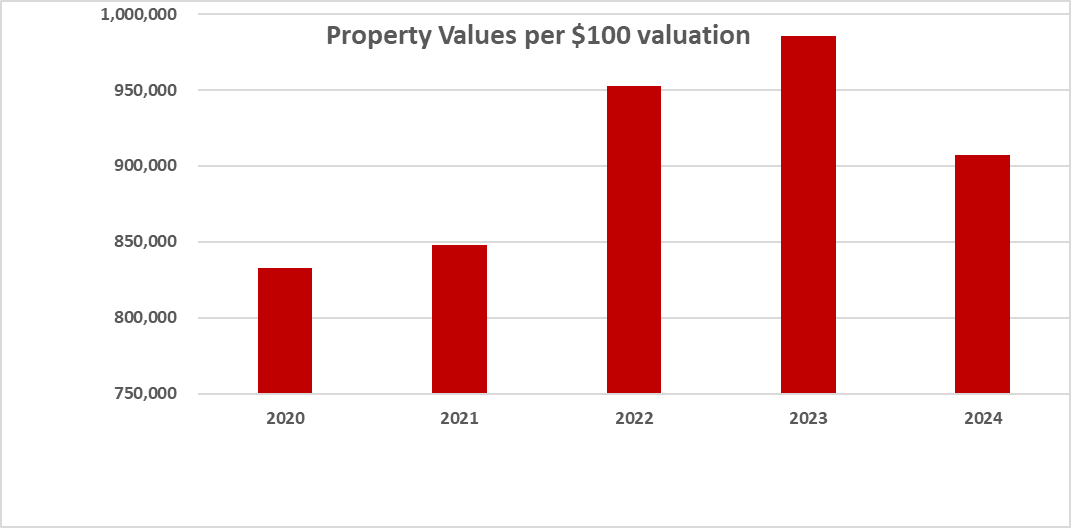
Source 2020 2021 2022 2023 2024 Enrollment TEA 1,002 914 872 829 762 ADA TEA 871.62 875.00 837.00 768.00 703.97 Staff FTEs TEA 180.50 183.50 183.00 180.00 155.00 Source: PEIMS information reported to TEA Revenues Source General Fund AFR: C-3 $ 12,846,492 $ 12,293,429 $ 12,730,379 $ 12,498,086 $ 11,703,907 Other AFR: C-3 3,204,615 3,207,657 5,311,576 6,058,498 5,527,644 Total Revenues $ 16,051,107 $ 15,501,086 $ 18,041,955 $ 18,556,584 $ 17,231,551 Per Student - Total Revenue $ 16,019 $ 16,960 $ 20,690 $ 22,384 $ 22,614 Expenditures Source General Fund AFR: C-3 $ 13,154,390 $ 11,832,923 $ 12,987,384 $ 13,943,503 $ 12,376,761 Other AFR: C-3 3,302,617 3,376,288 5,264,000 6,024,800 5,565,818 Total Expenditures $ 16,457,007 $ 15,209,211 $ 18,251,384 $ 19,968,303 $ 17,942,579 Per Student - Total Expenditures $ 16,424 $ 16,640 $ 20,930 $ 24,087 $ 23,547 Property Tax Rate per 100 valuation Source Propert value CAD 832,807 848,235 952,479 985,405 907,044 Total Property Tax Revenue per 100 valuation $ 832,807 $ 848,235 $ 952,479 $ 985,405 $ 907,044 Property Tax Revenue Source Maintenance & Operations AFR $ 817,929 $ 841,848 $ 846,573 $ 855,043 $ 604,696 Interest & Sinking AFR 305,670 385,571 423,015 444,820 396,197 Total Property Tax Revenue $ 1,123,599 $ 1,227,420 $ 1,269,588 $ 1,299,863 $ 1,000,893 Per Student - Total Property Tax Revenue $ 1,121 $ 1,343 $ 1,456 $ 1,568 $ 1,314 Property Tax Rates Source Maintenance & Operations AFR: J-1 $ 1.0165 $ 1.0029 $ 0.9315 $ 0.8995 $ 0.6668 Interest & Sinking AFR: J-1 $ 0.3843 $ 0.4689 $ 0.4689 $ 0.4689 $ 0.4689 Total Property Tax Rate $ 1.4008 $ 1.4718 $ 1.4004 $ 1.3684 $ 1.1357 Source: Annual Financial Report Per Student Revenues Source 2020 2021 2022 2023 2024 General Fund 12,820.85 13,450.14 14,599.06 15,076.10 15,359.46 Other 3,198.22 3,509.47 6,091.26 7,308.20 7,254.13 All Funds 16,019.07 16,959.61 20,690.32 22,384.30 22,613.58 Per Student Expenditures Source 2020 2021 2022 2023 2024 General Fund 13,128.13 12,946.31 14,893.79 16,819.67 16,242.47 Other 3,296.02 3,693.97 6,036.70 7,267.55 7,304.22 All Funds 16,424.16 16,640.27 20,930.49 24,087.22 23,546.69 Revenue Local $ 1,404,693 $ 1,401,097 $ 1,559,794 $ 1,889,679 $ 1,672,167 State 12,324,254 11,804,379 11,775,101 11,333,735 11,493,616 Federal $ 2,322,160 $ 2,295,610 $ 4,707,060 $ 5,333,170 $ 4,065,468 Total Revenue $ 16,051,107 $ 15,501,086 $ 18,041,955 $ 18,556,584 $ 17,231,251 Local $ 1.40 $ 1.40 $ 1.56 $ 1.89 $ 1.67 State $ 12.32 $ 11.80 $ 11.78 $ 11.33 $ 11.49 Federal $ 2.32 $ 2.30 $ 4.71 $ 5.33 $ 4.07 Total Revenue $ 16.05 $ 15.50 $ 18.04 $ 18.56 $ 17.23 Taxable Values 82,101,713 92,633,808 97,323,713 105,109,610 11 $ 7,080,234 $ 6,363,484 $ 7,827,929 $ 7,627,766 $ 7,486,961 12 127,271 143,845 325,929 209,589 165,568 13 468,884 606,048 994,156 1,374,223 1,502,047 21 292,728 195,037 284,708 234,608 117,150 23 845,937 806,466 926,013 966,215 859,770 31 312,966 374,764 372,788 416,846 389,831 32 25,034 25,879 30,470 34,001 36,638 33 168,858 176,300 217,408 192,416 191,371 34 607,248 467,745 238,904 244,488 259,935 35 950,309 800,507 879,909 1,022,204 916,358 36 379,267 372,371 370,501 360,830 356,178 41 994,197 916,781 935,349 835,340 810,627 51 1,682,079 1,510,640 2,002,273 2,014,434 1,902,824 52 439,634 304,484 446,553 525,414 697,013 53 539,042 553,604 457,062 458,497 541,424 61 170,292 153,732 260,433 230,160 166,144 71 577,857 638,640 808,503 839,718 876,004 72 733,218 663,179 483,789 459,677 440,548 73 1,907 120,435 2,790 2,000 2,220 81 44,972 - 367,684 1,901,117 208,005 99 15,073 15,270 18,233 18,760 15,983 Total Expenditures $ 16,457,007 $ 15,209,211 $ 18,251,384 $ 19,968,303 $ 17,942,599 Instruction and Instr. Rel. Svcs. $ 7.7 $ 7.1 $ 9.1 $ 9.2 $ 9.2 Instructional and School Leadership 1.14 1.00 1.21 1.20 0.98 Student Support Services 2.44 2.22 2.11 2.27 2.15 Administrative Support Services 0.99 0.92 0.94 0.84 0.81 Support Services 2.66 2.37 2.91 3.00 3.14 Ancillary Services 0.17 0.15 0.26 0.23 0.17 Debt Service 1.31 1.42 1.30 1.30 1.32 Capital Outlay 0.04 - 0.37 1.90 0.21 Intergovernmental Charges 0.02 0.02 0.02 0.02 0.02 Total $ 16.46 $ 15.21 $ 18.25 $ 19.97 $ 17.94 Instruction $ 7.68 $ 7.11 $ 9.15 $ 9.21 $ 9.15 Instructional and School Leadership $ 1.14 $ 1.00 $ 1.21 $ 1.20 $ 0.98 Student Support Services $ 2.44 $ 2.22 $ 2.11 $ 2.27 $ 2.15 Administrative Support Services $ 1.01 $ 0.93 $ 0.95 $ 0.85 $ 0.83 Nonstudent Services $ 2.83 $ 2.52 $ 3.17 $ 3.23 $ 3.31 Debt Service $ 1.31 $ 1.42 $ 1.30 $ 1.30 $ 1.32 Capital Outlay $ 0.04 $ - $ 0.37 $ 1.90 $ 0.21 Total $ 16.46 $ 15.21 $ 18.25 $ 19.97 $ 17.94 Fund Balance Nonspendable/Restricted 471,329 444,239 457,147 475,544 406,725 Committed/Assigned 354,905 1,483,013 670,460 289,220 246,661 Unassigned 7,339,549 6,515,442 7,128,990 6,080,114 5,588,195 Total Fund Balance $ 8,165,783 $ 8,442,694 $ 8,256,597 $ 6,844,878 $ 6,241,581 Fund Balance Nonspendable/Restricted $ 0.47 $ 0.44 $ 0.46 $ 0.48 $ 0.41 Committed/Assigned $ 0.35 $ 1.48 $ 0.67 $ 0.29 $ 0.25 Unassigned $ 7.34 $ 6.52 $ 7.13 $ 6.08 $ 5.59 Total Fund Balance $ 8.17 $ 8.44 $ 8.26 $ 6.84 $ 6.24